Deliberate Friction - A Data Engineering Case Study
Introduction
In software engineering, we're taught to eliminate friction. Continuous integration, automated pipelines, and frictionless deployments are cornerstones of modern development practices. But what if some friction is exactly what we need? This case study explores how deliberately introducing friction into data workflows improved data quality, reliability, and ultimately business outcomes.
The Evolution of Data Engineering
As the field of data engineering progresses, we're seeing a shift in responsibilities. Data engineers are no longer just pipeline builders—they're becoming bridges between backend development and analytics. With analytics engineers moving closer to business stakeholders, data engineers must leverage their computer science background to understand both developer constraints and the needs of analysts, product managers, and business KPIs.
Our organization, like many others, struggled with a classic problem: disconnection between product vision, technical implementation, and data analysis. Product managers would request tracking without clear specifications, developers would implement events without understanding analytics needs, and data teams would struggle to translate the resulting data into meaningful insights.
The Problem: Data Without Context
Our analytics ecosystem wasn't optimized to support the next growth phase, where success hinged on measuring the impact of big bets and new features. We had two primary data sources, each with significant limitations:
-
Backend tables: Built by developers to manage technical workings of features, not to reflect how users interact with various components or what constitutes 'success.' These tables provided a real-time snapshot but lacked historical perspective due to data overwriting.
-
Frontend tracking (Mixpanel): Suffered from multiple issues including:
- Lack of centralized ownership
- Reliability problems (ad blockers causing ~10-12% data loss)
- Growing maintenance debt (ballooning event count with little documentation)
- Testing complexity within QA processes
When asking PMs how they'd measure the success of an upcoming feature, responses varied widely. Similarly, the data team had no consistent method for helping PMs gauge performance. The issue wasn't that the data team wasn't providing data products or that PMs lacked understanding—the problem was with the ecosystem itself.
Failed Attempts: Creating Soft Friction
My first attempt to address these issues was through an ADR (Architecture Decision Record) proposing a structured approach to frontend tracking. I defined five roles within an event's lifecycle to establish loose SLAs on a team-by-team basis, from event ideation through to analytics consumption.
I tried implementing a ClickUp board where frontend events would be reviewed by data engineers and analysts before deployment. This created a checkpoint to ensure events made sense from an analytics perspective and addressed PM data literacy gaps.
This approach failed to gain traction. The "soft friction" wasn't enough to change entrenched behaviors, and the lack of technical integration meant it was easily bypassed.
The Solution: Deliberate Friction Through Event Publishing
The next approach involved "harder" friction—working directly with developers to implement a publisher-subscriber (PubSub) system for analytics events. This approach embraced the fundamental differences between how data teams and backend teams think, using event-driven architecture to decouple producers and consumers.
The key insight was that data engineers and backend teams often promote competing decisions for their own use cases. Instead of fighting this reality, we embraced it by:
- Implementing backend event publishing for analytics-oriented data points
- Creating a clear decision framework (the Data Decision Map) for when to use each data source
- Requiring lightweight ownership from developers without impacting codebase maintainability
The PubSub system addressed the historical limitations of our database tables while providing more reliable data than frontend tracking. It created a dedicated channel for analytics data that wasn't subject to the constraints of either previous approach.
Why Friction Works: Quality Through Checkpoints
The deliberate friction we introduced served several critical purposes:
- Data Auditing: Checkpoints in the process allowed us to verify that events were correctly configured before they reached production
- Clear SLAs: The structured workflow established expectations for each team's responsibilities
- Data Trustworthiness: With proper validation and documentation, the resulting data became more reliable for decision-making
Unlike traditional software engineering approaches that aim to minimize friction, we recognized that some friction is beneficial when it comes to data quality. Each checkpoint served as an opportunity to ensure that the data would meet the needs of its ultimate consumers.
Implementation and Adoption
We created a clear decision framework to guide teams on when to use each data source:
- Frontend Data (Mixpanel): For understanding product usage and feature interactions within sessions
- Backend Tables: For real-time snapshot of application state
- PubSub Events: For tracking historical movements and transformations not logged in tables
This framework helped stakeholders make appropriate choices without requiring deep technical knowledge. It also emphasized the strengths and limitations of each approach, improving data literacy across teams.
The implementation required collaboration across multiple teams: - Infrastructure changes to support the PubSub architecture - Developer education on event publishing standards - Documentation of the event schema and usage guidelines - Analysts training on working with the new data source
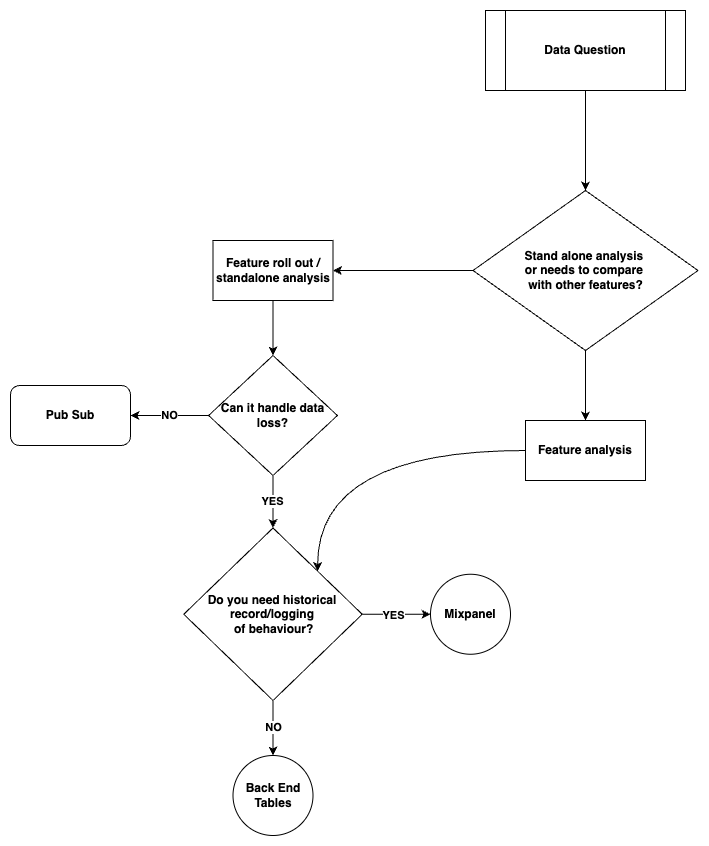
Figure 1: Data Decision Flowchart. This decision tree guides teams through selecting the appropriate data source based on their analytical needs. Starting with a data question, it first determines if the analysis is standalone or requires feature comparison. For standalone analysis, it evaluates tolerance for data loss and historical logging requirements. The flowchart directs users to either PubSub events (for critical standalone analysis), Mixpanel (for behavioral insights with acceptable data loss), or Backend Tables (for current state analysis without historical requirements).
Results: Bridging the Gap
The implementation of deliberate friction through our PubSub system and decision framework provided several key benefits:
- Improved Data Quality: Events were properly configured and validated before reaching analytics
- Clear Ownership: Each step in the process had defined responsibilities
- Better Feature Measurement: PMs gained reliable data for measuring feature performance
- Reduced Technical Debt: Centralized approach reduced the proliferation of ad-hoc tracking solutions
Perhaps most importantly, it created a shared understanding between product, engineering, and data teams. The friction points became opportunities for cross-functional alignment rather than bottlenecks.
Lessons Learned
Through this journey, several key insights emerged:
- Not All Friction is Bad: Carefully designed checkpoints improve data quality while maintaining efficiency
- Data Engineers as Bridges: Position between backend and analytics requires advocating for both technical feasibility and analytical needs
- Decision Frameworks Matter: Clear guidelines reduce confusion and improve consistency
- Ownership Must Be Explicit: Without defined responsibilities, data quality suffers
The evolution of data engineering requires us to reconsider our aversion to friction. As we bridge the gap between technical implementation and business value, some deliberate friction ensures that data serves its ultimate purpose: informing better decisions.
Conclusion
As data engineering evolves, practitioners should consider where friction adds value rather than assuming it should always be eliminated. By creating structured processes for data production—not just consumption—we can significantly improve the quality and usefulness of our analytics.
The counter-intuitive approach of adding friction paid dividends in our organization. It forced important conversations, improved cross-functional understanding, and ultimately delivered more reliable insights for decision-makers.
In your organization, consider where a lack of friction might be causing data quality issues, and don't be afraid to implement deliberate checkpoints that ensure your data can be trusted to drive business outcomes.